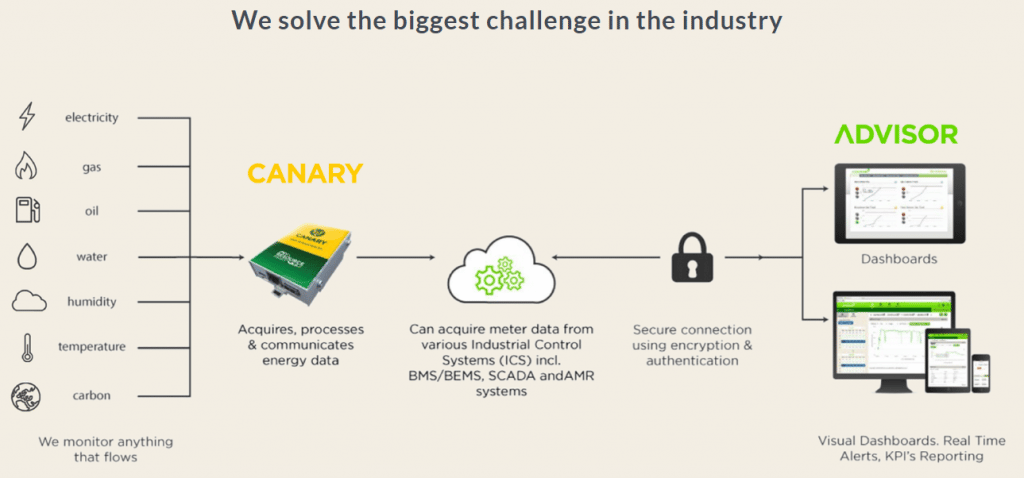
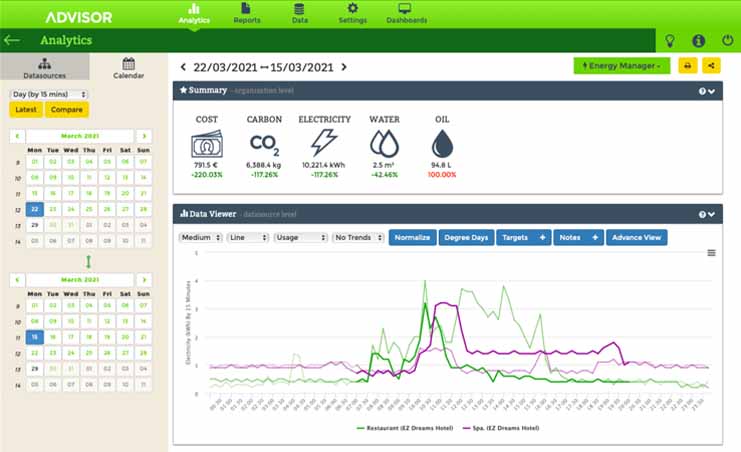
Advisor Energy Monitoring Software acquires and analyses energy usage data from energy meters and converts it into management information. Real-time energy data can be visualised as easily understood charts, graphs and maps.

Advisor Energy Monitoring Software acquires and analyses energy usage data from energy meters and converts it into management information. Real-time energy data can be visualised as easily understood charts, graphs and maps. Users can create targets, Key Performance Indicators (KPIs) and automated reports to plan, measure and track efficiency increases.

Tableau software offers interactive data visualisation dashboards and reports focused on business intelligence, which can help Advisor customers investigate specific aspects of their energy data. Follow the steps below to export your Advisor data for use with Tableau.
Export your Advisor Data
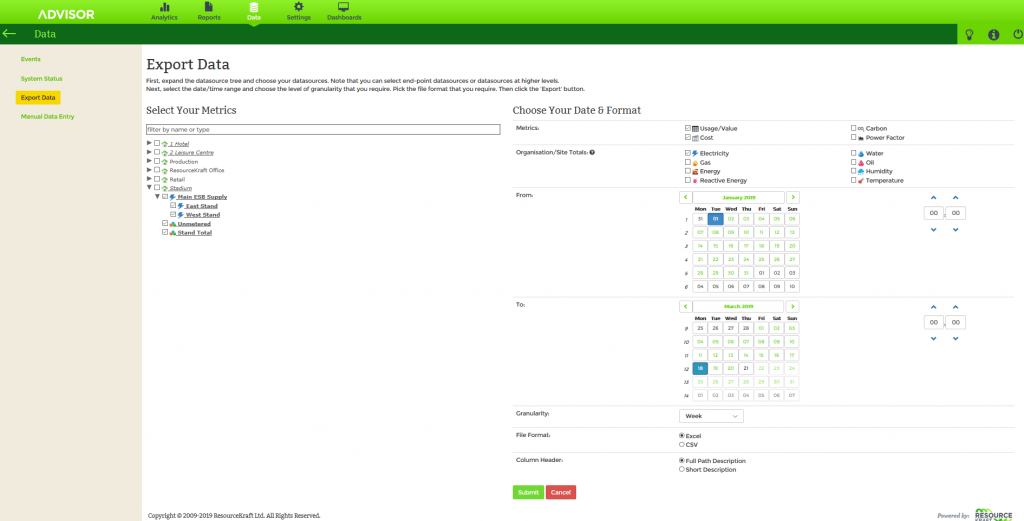
First you must login to your Advisor account. Navigate to “Export Data” via the Data tab on the top of your screen. This is where you can then export your data. Make sure that you export the data as CSV file type.

- Select the data sources you wish to export.
- Select desired metrics
- Select the site total you wish to export
- Select “To” and “From” dates
- Select granularity
- Select CSV file format
Import you Advisor data to Tableau Desktop
Next you will need to download Tableau desktop and create an account; https://www.tableau.com/products/trial
Once downloaded and logged in you will see the following screen;

To import a CSV file go to;
Connect > To a file > Text file
Once this file opens you can then use your data to create many custom graphs/visualisations.

You can then save and publish these custom-made graphs on Tableau online for everyone in your organization to see.

Download Trial here; https://www.tableau.com/products/trial
Tableau online Trial; https://www.tableau.com/products/online/request-trial
Other Trials; https://www.tableau.com/products/server/options


