The power spectrum of a signal is a fascinating way of digging deeper into understanding complex systems. If you recall your basic physics, a power spectrum shows how the power of a signal is distributed over its frequency range.
I have a long-standing interest in chaotic systems and fractals and came across a fascinating paper from 1975 by Voss and Clarke[1] which illustrates how what’s termed “1/f noise” or pink noise surfaces in the power spectrum of many natural processes. I won’t go into the detail here (you can read the paper for the finer points) but when you take a log-log plot of the frequency against power from various processes you end up with a distribution that shows a slope of approximately -1.
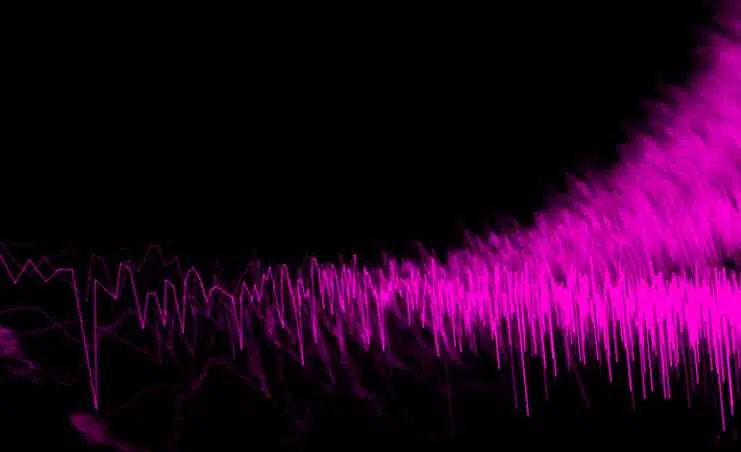
I don’t always take results for granted, being a bit of an empiricist, so I took their results for Bach’s Brandenberg concerto and reproduced the experiment across one of the shorter pieces. Here’s what the power spectral density (PSD) looks like:

Just to be sure, I downloaded a sample of White Noise (where the power spectrum is equally distributed over all frequencies and performed the same procedure). I think we can agree that the slope there is pretty close to zero:

Let’s try some other examples to see if pink noise is as commonplace as is thought. A few papers reference it cropping up in the natural physical environment[2], albeit with mixed results, but nevertheless it does seem to occur in some rather diverse and somewhat surprising systems. How about in energy consumption related phenomena? (As that’s the market we’re in, after all.)
I took some detail on the average total energy demand for Ireland over December 2016 and computed the PSD:

It does indeed look like 1/f noise is present in the PSD. So, power demand driven by people based upon a range of phenomena (day/night, working hours, TV schedules, etc.) appears to contain the same pattern.
Ok, interesting, so let’s get a little more esoteric. How about we try wholesale energy cost for the electricity grid (again for December 2016)? This is based on system demand along with other factors such as generator availability, energy surplus, and other market related factors:

Here we’re seeing peaks for the regularity of daily changes but interestingly we don’t see the 1/f pattern. Has the fact that we’ve introduced some market related trading into the mix of influences removed this particular kind of noise? Indeed, if anything other than the stronger peaks around the daily changes there seems to be a pattern similar to that of the white noise we analysed earlier.
So, in summary, 1/f noise seems to be present in the total demand for power across Ireland but not present in the spot prices charged for energy at a higher level. Unfortunately I don’t have the time to go into this in more detail, but it’s interesting that introducing another layer of abstraction should seemingly remove this seemingly natural phenomenon.
With such a brief study it’s difficult to draw implications for energy demand, but perhaps there is a significance for energy demand prediction. Quickly producing a PSD plot of predicted energy demand would easily show the presence of 1/f noise. If it’s missing then perhaps it’s worthwhile checking the model again? More research would be required but maybe we have revealed a quick and relatively easy sanity check for such predictions? More research required!
References
[1] ‘1/f’ noise in music and speech’ – Nature, Vol. 258, No. 5533, pp. 317-318 November 27, 1975
[2] ‘Presence of 1/f noise in the temporal structure of psychoacoustic parameters of natural and urban sounds’, Ming Yang, Bert De Coensel, Jian Kang, The Journal of the Acoustical Society of America, Volume 138, Issue 2, 10.1121/1.4927033
[2] ‘Presence of 1/f noise in the temporal structure of psychoacoustic parameters of natural and urban sounds’, Ming Yang, Bert De Coensel, Jian Kang, The Journal of the Acoustical Society of America, Volume 138, Issue 2, 10.1121/1.4927033
Keywords
Energy, Pink Noise, Fourier, Power, Spectral Density, Energy Consumption, Analysis
Contact us
Recommended for you
Get more insights and assorted energy transition and development news. 06.21.22
Government funding of up to €50,000 for Energy Monitoring & Tracking
Government funding is available for up to €50,000 for the capital costs associated with Energy Monitoring and Tracking, as part of an overall fund…- 03.03.22
Energy Efficiency from Energy Monitoring
There’s an old adage in management circles along the lines of “if you can’t measure it, then you can’t manage it” that turns out… - 03.01.22
Recruiting: Senior Software Engineer
The other guys will tell you that they are making the world a better place. At ResourceKraft we are actually doing it! All the while leading…  04.20.21
Self-Install Energy Monitoring Equipment
With the lingering effect of Covid-19 feeding into 2021/22. Access to plant facilities is highly restricted. No company wants to risk production due to… 03.31.21
RESOLVE Power Quality: Remote Monitoring Covid-19 & Brexit
Access to production facilities in a Covid era can be restrictive and slow. You can’t afford downtime and the head-ache of delayed service. Additionally,…-
03.25.21
Advisor Energy Systems: Remote Monitoring
Covid-19 has restricted the free movement of people in the workplace. Restricted access to site areas is required to maintain health and safety standards.…